Ear to the ground
09 December 2022

It was the turn of Halifax to report weaker house prices this week, following a negative report by Nationwide last week. Halifax reported that house prices had fallen by 2.3% in the month of November, the largest drop since November 2008. In the US meanwhile, some economic data surprised to the upside. The ISM Non-Manufacturing PMI for November came out at a stronger-than-expected 56.5 against a consensus forecast of 53.3, showing that the sector was expected to remain in a state of expansion. This somewhat contradicted the S&P Global Services PMI figure which, at 46.2, signifies a fall in activity in the sector.
And so, investors continue to grapple with w the investment ramifications of this economic slowdown. Some would argue that this is possibly the most well-predicted forecast recession of all time. Indeed, the latest poll of economists by the Financial Times reveals that 85% expect a recession by next year.
Leading economic indicators are pointing to a recession, and the bond market, looking at the inversion of the US yield curve, continues to indicate that a recession is inevitable. Many curves are now inverted in this asset class, none more so than the US 10-year/1-year Treasury yield curve, which is at its most inverted level since the early 1980s and is fast approaching the level seen in the mid-1970s.
The threat/potential for the recession now appears to be being accepted by analysts, where we are now seeing more downgrades than upgrades to earnings expectations in the US. Some would argue however that earnings forecasts remain too high given the economic environment.
However, it is important to remember that the equity market can be seen as a leading indicator. Typically, although not always, the market is likely to move ahead of any confirmation of economic strength or weakness. It is of course open to surprises to the upside and downside but, historically, is often ahead of the game when it comes to the forecasting direction.
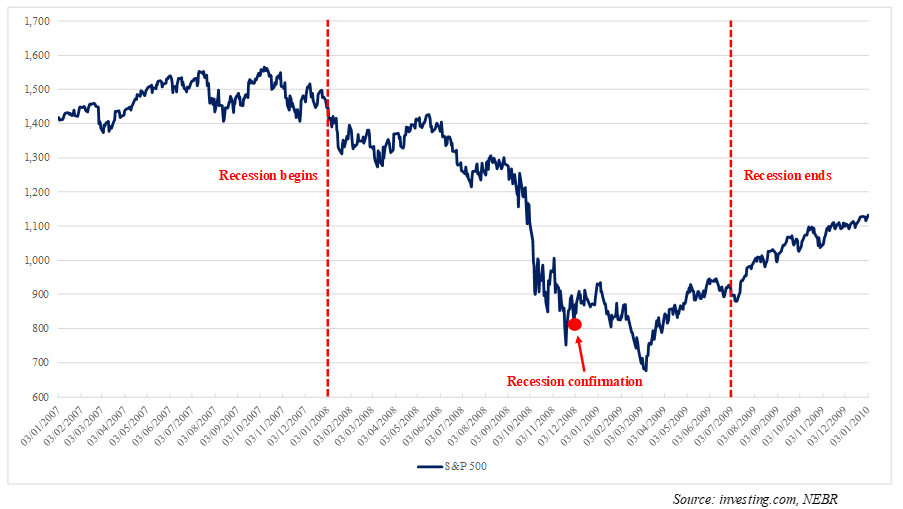
Take for example the US recession of 2007 to 2009, as depicted in the chart above. The US recession was officially declared on the 1st of December 2008. The start of this recession was backdated to December 2007, however. By the time this official declaration was made the S&P 500 had already fallen from the 1,400 level at the end of December 2007 to 800. Whilst the market would continue to fall after the official declaration, most of the fall in the equity market had already been seen. The same is also true the other way, whereby the equity market started to climb well before the end of the recession was reached.
So, in conclusion, the equity market is a forward-looking leading indicator. Therefore, I guess the question is, how deep will this expected recession be and how much of that is already priced into the market?
This article is for information purposes only and should not be construed as advice. We strongly suggest you seek independent financial advice before taking any course of action.
The value of this investment can fall as well as rise and investors may get back less than they originally invested. Past performance is not necessarily a guide to future performance.
The Fund is suitable for investors who are seeking to achieve long-term capital growth.
The tax treatment of investments depends on the individual circumstances of each client and may be subject to change in the future. The above is about a UK-domiciled investor only and would be different for those domiciled outside the UK. We strongly suggest you seek independent tax advice before taking any course of action.
Subscribe Today
To receive exclusive fund notifications straight into your inbox, please complete this form.